QuickIPS for Quuppa ― Indoor Positioning System developed by FileMaker

Notice

 We offer a demonstration of QuickIPS for Quuppa. If you are interested, please apply here.

 We, Tsuchiya Planning Company, are planning to release the FileMaker-developed IPS application QuickIPS for Quuppa for indoor positioning systems by Quuppa in the Spring of 2024. This product receives the real-time location information of people and objects provided by the Quuppa Positioning Engine and is developed using FileMaker to display their locations on the maps of devices such as PC, iPhone and browser.

This article provides an explanation of this product.

What is Quuppa?

    Quuppa is a system designed to provide indoor location information for people and objects. It is a product of the Finnish company Quuppa Oy. This product is referred to as a Real-Time Location System (RTLS) or Indoor Positioning System (IPS). In this system, tags (beacons) are attached to people and objects, and the system calculates their positions based on the signals emitted by these tags. It is somehow similar to GPS but specialized for indoor use in areas where satellite signals may not reach, and it offers higher positioning accuracy than GPS. Additionally, since the tags use Bluetooth Low Energy (BLE), they are energy-efficient and can operate for extended periods.


   Quuppa primarily consists of tags, locators, and positioning engine (software).

Tag (Sensor)  

QT1-1 tag
Attached to people or objects and emit signals, sometimes referred to as beacons.
Locator

Q35 Locator
Receives signals from the tags and sends them to the positioning engine.
Positioning Engine (Software)

Quuppa Positioning Engine
Receives tag information sent through locators, calculates the position information for each tag, and passes it to the application. Server required.


QuickIPS for Quuppa

    Quuppa's positioning engine provides tag location information in CSV and JSON formats through UDP Push and REST. User applications, such as displaying the positions of people and objects on a map, are typically developed by the implementing companies. However, developing these applications can be time-consuming and costly. Our QuickIPS for Quuppa is designed to reduce the effort and cost involved in this development work.

Features

1. Possible to quickly implement IPS applications

    QuickIPS for Quuppa (hereinafter referred to as "QuickIPS") provides a 'Floormap' feature that displays the locations of tags on a map. Installation is easy, and with initial configuration such as importing floor images and aligning coordinates, you can quickly display the tag locations on the floor map.

    QuickIPS allows IPS system implementation personnel to envision the applications that end-users will use in the early stages of the project.

2. Customization with FileMaker

    QuickIPS is created with FileMaker, and a development version will also be provided. FileMaker is well-known as a low-code development tool, and developers can use FileMaker to customize QuickIPS, enabling them to develop high-quality IPS applications in a short amount of time.

3. Variable floormap development tools

 QuickIPS offers five types of floormaps. When customizing using the development version, in addition to FileMaker's standard features, you can also utilize JavaScript library plotly (free) and the FileMaker plugin xmCHART (paid third-party).

3-1. Scatter floormap

 It is developed using FileMaker's scatter plot chart, and while its features are limited, development is straightforward.

3-2. Object floormap

  It is developed using FileMaker's features, primarily merge fields and scripts, allowing for more advanced development compared to the Scatter Floor Map. Additionally, this floor map is unique compared to other floor maps, and customization during installation is required, necessitating the purchase of the development version.

3-3. xmCHART floormap

 It is developed using the FileMaker plugin xmCHART (paid), allowing the development of floor maps through the use of external functions provided by this product for FileMaker. Mastery of these external functions may require some learning, but they offer excellent flexibility and scalability for chart creation, and can be used for various chart types.

3-4. Plotly floormap

 It is developed using JavaScript and the JavaScript library Plotly. Developers are required to have skills in Plotly, but it offers excellent flexibility and scalability for chart creation and can be used to create various types of charts.

3-5. QuickIPS page (FileMaker client license independent)

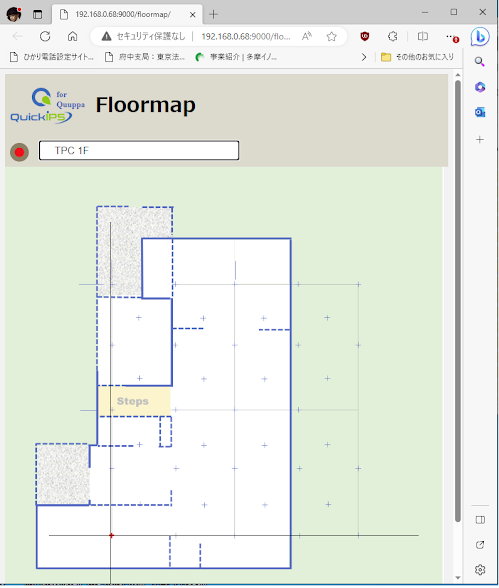
 Unlike the aforementioned floormaps, it does not require FileMaker client licenses and displays the floormap in a web browser. As it does not require the same licenses, it is cost-effective in environments with a large number of users.

   However, for operation, one FileMaker Server license and one FileMaker Pro license for configuration management are required. Additionally, building a web server using Python, Plotly, Flask, and Waitress may also be necessary.


3-6. Development tools comparison

 The floorsmap are developed using the following five tools.

Floormaps
(Dev tools)

Initial  dev

Diffi-culty

Exten-sibility  Additional information
1.Scatter low low

  • Using the standard FileMaker scatter plot chart, it is simpler compared to Object.
  • Simpler compared to object tool.

2.Object
Medium Medium

  • Develop using FileMaker standard merge fields and scripts.
  • Coordinates in centimeters are rounded to meters.
  • Experience in FileMaker development required.
  • A development version is required for development.

3.xmCHART

High

High

  • Uses xmCHART (separate purchase required).
  • Utilizes xmCHART's proprietary language.
  • Development through FileMaker's external functions.
  • Possible to develop features such as heatmaps and tracking (path tracking), among others.

4.plotly High High

  • Uses plotly (freeware) and JavaScript with plotly.
  • Possible to develop features such as heatmaps and tracking (path tracking), among others.

5.QuickIPS pages Very high Very high
  • Executes in a web browser.
  • Unlike other maps, it does not require FileMaker client licenses for each device.
  • Developed using JavaScript and plotly
  • Less feature-rich compared to other maps.
  • High development complexity (non-low-code).
  • Requires a web server

3-7. "Picker" for selecting tags

 You can use the Picker to select multiple tags of interest and display only those on the floor map.

Multiple tags selectable

 4. Supports three modes: AUTO, MANUAL, and HISTORY


AUTO: Automatically displays tag locations in real-time.
MANUAL: Clicking the update button displays the current tag location.
HISTORY: Displays past location saved in the database as specified by the user.

5. Error graph and error summary features

 By pre-registering the coordinates of stationary tags in the tag master, you can graphically visualize or aggregate the discrepancies between the actual coordinates and the coordinates calculated by Quuppa. Use this when determining the placement of locators while checking the accuracy of the calculated coordinates.


6. Available on various platforms

 The various features of QuickIPS operate on various platforms.

No Features FM Pro FM Go WebDirect Browser Note
1 Configuration  
2 Floormap adjustment  
3 AUTO mode  
4 HISTORY mode  
5 MANUAL mode  
6 Scatter floormap  
7 Object floormap  
8 xmCHART floormap  
9 Plotly floormap  
10 QuickIPS page  
11 Positioning error summary  
12 Positioning error graph  
13 Picker (tags selection)  

Note:

  • 'Quuppa' is a trademark of Quuppa Oy.
  • FileMaker Pro is required for initial setup and maintenance.
  • WebDirect is a feature of FileMaker Server that allows you to use functions created in FileMaker on a web browser. To use WebDirect, in addition to FileMaker Server, a FileMaker client license is required for each user.


NuckyT

Send Location Information via UDP - TPC_IPS/QuickIPS Extension

Information

Our indoor positioning system TPC_IPS Ver1.0 was released on April 1, 2022.

We also plan to release IPS application templates "QuickIPS" and "TPC_IPS Web API" which allow interactions with external IPSs/RTLSs in the future.

Our indoor positioning system, TPC_IPS, analyzes beacon signals using a positioning engine (TCOT) on the application server and stores the calculated location information of each beacon in a database. Users access the database from client machines in a timely manner to retrieve location information, which is then used in front-end applications such as floormaps. This is a Pull method in which the client requests information from the server.

The drawback of the Pull method is that it generates extra queries and increases the server load as the number of clients increases.

On the other hand, there are systems which uses the Push method that send data from the server side to the client. This time, we implemented a process to automatically update the client's floormap by broadcasting the location information calculated by TPC_IPS's location positioning engine (TCOT) to the network via UDP.

The module configuration between server and client is illustrated below.

A program called tcot_sender.py resides on the server, which calls TCOT to obtain location information, which is then broadcast via UDP using python sockets.

On the client, tcot_receiver.py listens for the above UDP and performs necessary tasks such as data processing when it receives UDP data.

QuickIPS is a front-end application and it displays the latest locations of beacons on the floormap. QuickIPS is developed in FileMaker, however, FileMaker itself unfortunately does not have socket communication capabilities, it cannot directly retrieve data from tcot_receiver.py.

Therefore, to enable socket communication between tcot_receiver.py and QuickIPS, we prepared a file called tcot_listener.html and embedded this html file in a Web viewer * on the floormap layout. tcot_listener.html creates a WebSocket and uses addEventLisner to wait for incoming data from tcot_receiver.py. Upon detecting incoming data, it calls up PerformScript() to run a FileMaker script to update the QuickIPS floormap.

*Web viewer is a feature that displays web pages directly in the FileMaker Pro layout.

This mechanism is not only available in FileMaker, but also in common web applications.

Below is a summary of the pros and cons of the UDP Push method we have implemented.

Pros

  • Faster data transfer than TCP communication
  • Reduced server load, especially when there are many users
  • System configuration flexibility
  • Real-time performance (less overhead, faster execution of client apps)

Cons

  • Compared to TCP communication, data loss (packet loss) may occur because transmitted data is not guaranteed
  • Processing of connection confirmation and data reception confirmation for UDP communication can be troublesome

注:
TPC_IPS ver1.0 does not support UDP Push. We plan to address this issue in future releases, but specifications are subject to change without notice.


Sachiko Kamezawa

IPS Related Blog Posts

  1. IPS Application Templates for FileMaker ― QuickIPS ―*
  2. Indoor Mobile Position Monitoring Model with iBeacon/Raspberry Pi 1  ―  Overview*
  3. Indoor Mobile Position Monitoring Model with iBeacon/Raspberry Pi 2   ―  RSSI/Distance Calibration and Trilateration*
  4. Indoor Mobile Position Monitoring Model with iBeacon/Raspberry Pi 3 ― Enhancement of Two-Circles-Oriented Trilateration (TCOT) and Measurement Results*
  5. Estimate the approximate position of the beacon with a small number of receivers in a large area such as Tokyo Dome(Google translate)
  6. Improving IPS Positioning Accuracy with Machine Learning*
  7. TIPS for making IPS testbeds(Google translate)
  8. Object Tracking for Visualizing The Movements of People and Objects on a Map*
  9. Send Location Information via UDP - TPC_IPS/QuickIPS Extension*
  • * indicates that original article translation into English has been completed by TPC.
  • "Google translate" indicates that clicking it will Google translate the original article, and may be translated into English in the near future by TPC.

TPC's IPS Products

Object Tracking for Visualizing The Movements of People and Objects on a Map

Information

Our indoor positioning system TPC_IPS Ver1.0 was released on April 1, 2022.

We also plan to release IPS application templates "QuickIPS" and "TPC_IPS Web API" which allow interactions with external IPSs/RTLSs in the future.

An IPS commonly includes a function called "object tracking," which is the ability to track and visualize the movement of people and objects (hereinafter this feature is called "object tracking"). The following figure is a sample of our object tracking using our products TPC_IPS and QuickIPS, and shows a two-dimensional map on the X and Y axes and time on the Z axis. The blue and orange lines indicate the positions of objects at different timestamps. For example, we can see that orange line (bcn0-5) was at the coordinates (0, 6) at 13:37:58.
This 3D graph can be rotated on the PC screen, so it is also possible to visually determine if the red and the blue are in contact or close proximity.

Note:

  • This object tracking feature is under developemnt as of April, 2022. We plan to include object tracking in the future releases of our products TPC_IPS and QuickIPS.
  • Specifications are subject to change without notice.
movements of objects with time sequence in 3D representation

Purposes

Object tracking is a function that displays the movement of people and objects on a map along with a time sequence, and can be displayed in 2D or 3D format. This is useful for accurately identifying the actions and movements of infectious disease carriers, visitors at a store, transport machines, employees, etc.

the movements of people and objects on on 2D map with the time sequence

Tools and Applications Used for Object Tracking

The tools and applications used in QuickIPS are as follows:

Tool/ApplicationPurpose
Python, matpotlib, etc. 2D/3D representation
pyodbc, ODBC, etc. issues sql queries to the database from Python, retrieves the properties such as coordinates, timestamps, and then send them to matplotlib.
FileMaker Pro
Note: mandatory for QuickIPS.
object tracking is available from the command line prompt. QuickIPS has the GUI to issue this Python command.

Specifications

  1. locations of objects with time sequence in 2D and 3D representations
    The Z-axis represents time in 3D.
  2. The following parameters are available on the QuickIPS GUI:
    parameter purpose
    time range specify the period for object tracking in twelve digit codes
    2D/3D select 2D or 3D tracking
    plotting formats select to show the tracking result image either in the QuickIPS Web viewer or in a separate Python-matplotlib window.
    beacons multiple beacons can be selected from the QuickIPS picker interface.

    How to Use
  1. Specify the range of timestamps for object tracking in [time] on the QuickIPS Window in 12-digit codes (YYYYYMMDDHHMMSS, which is the date and time the object coordinates were measured).

  2. Choose where you want to see the object tracking result in [Plot in...]. If you choose [QuickIPS], you will see the tracking result in the QuickIPS Web viewer; if you choose [Separate window], you will see the tracking result in a separate Python-matplotlib window. In the following example, [QuickIPS] is selected.
  3. Use Picker icon to choose beacon(s) to track. The example above shows the two beacons chosen: bcn2-8 and bcn0-5.
  4. If you want to see the 2D tracking result, choose [2D] and click Tracking button . Then, you will see the tracking result of the two beacons specified, along with the routes and timestamps.


    If you chose [Plot in...] in step 2 above, you would see the tracking result in a separate Python-matplotlib window as follows:

    movements of people and objects are shown in 2D map along with timestamps

    In this window, you can zoom in and zoom out the floow map to check out the details.
  5. 3D Object Tracking

    If you want to see the object tracking result in 3D, first choose [3D] in the radio button in step 4 above, and then click Tracking button . If QuickIPS is selected in [Plot in...] at this moment, you will see the tracking result in the Web viewer in the same window.

    mouse operation not allowed for the image in Web viewer

    If "Separate window" was chosen in [Plot in...] at this monent and if you click Tracking button , you will see the 3D tracking result in a separate Python-matplotlib window.

    You can rotate, zoom in, and zoom out this image by using your mouse or operation icons in the window. You can see how it works in the following video clip.

* The specifications of QuickIPS and object tracking are subject to change in the future.

Sachiko Kamezawa

IPS Related Blog Posts

  1. IPS Application Templates for FileMaker ― QuickIPS ―*
  2. Indoor Mobile Position Monitoring Model with iBeacon/Raspberry Pi 1  ―  Overview*
  3. Indoor Mobile Position Monitoring Model with iBeacon/Raspberry Pi 2   ―  RSSI/Distance Calibration and Trilateration*
  4. Indoor Mobile Position Monitoring Model with iBeacon/Raspberry Pi 3 ― Enhancement of Two-Circles-Oriented Trilateration (TCOT) and Measurement Results*
  5. Estimate the approximate position of the beacon with a small number of receivers in a large area such as Tokyo Dome(Google translate)
  6. Improving IPS Positioning Accuracy with Machine Learning *
  7. TIPS for making IPS testbeds(Google translate)
  8. Object Tracking for Visualizing The Movements of People and Objects on a Map*
  9. Send Location Information via UDP - TPC_IPS/QuickIPS Extension*
  • * indicates that original article translation into English has been completed by TPC.
  • "Google translate" indicates that clicking it will Google translate the original article, and may be translated into English in the near future by TPC.

TPC's IPS Products

Improving IPS Positioning Accuracy with Machine Learning

Information

Our indoor positioning system TPC_IPS Ver1.0 was released on April 1, 2022.

We also plan to release IPS application templates "QuickIPS" and "TPC_IPS Web API" which allow interactions with external IPSs/RTLSs in the future.

We have been developing an IPS (Indoor Positioning System, which is a system that estimates the position of things indoors) using Raspberry Pi terminals and beacons. Last year, we posted a few blog articles and YouTube videos on a prototype system with our original algorithm called TCOT (Two-Circles-Oriented Trilateration).

Trilaterational position estimation  systems including TCOT has a great advantage that it does not require prior data accumulation and data updates compared to the fingerprinting method, but on the other hand, it has a disadvantage that the positioning accuracy is low.

This time, we laid Raspberry Pi terminals (hereinafter sometimes referred to as terminals) and beacons in the test environment, and stored the position coordinates of the beacons and the terminals, and the RSSI values of the beacons acquired by the terminals in the database in advance (this is called "fingerprinting"). Then, we verified how much the positioning accuracy would be improved by applying the fingerprint data to machine learning.

There are numerous machine learning tools, and this time we decided to use Orange and scikit-learn. Orange is a data mining tool which can be used without programming, and scikit-learn is famous as a machine learning library for Python. Finally, we plotted the respective estimated position results with matplotlib.

Test Environment

The test environment is prepared by arranging 54 Aplix beacons and 13 Raspbery Pi terminals in our office as shown in the figure below. 13 terminals are placed on the four vertices of a square with a side of 4 m (this is called a grid), and terminals are also placed in the center of each square. The beacons to be positioned are placed in  at both [R] and [B] in the figure.

Data and Features

The database table for storing fingerprint data contains a number of fields. Among them, the terminal names (N1T, N2T, N3T... in the figure below) and the distances (N1R, N2R, N3R... in the figure below) between the terminal and the beacon based on the RSSI values acquired by each terminal are used as features used for machine learning. The objective variables (labels) are the position coordinates (ax, ay) of the beacons.

Some fingerprint data imported from the database to an Excel spreadsheet

Position Estimation Using Machine Learning


Position Estimation with TCOT

Before moving on to machine learning, please take a look at the following matplotlib plot result of the estimated positions calculated by our Two-Circles-Oriented Trilateration (TCOT):

Figure 1: Plot result of estimated positions by TCOT


The start point of each arrow is the actual position of the beacon, and the end point is the estimated coordinates calculated by TCOT. 

We are going to show you the machine learning tool we used this time and apply the same data used in TCOT to machine learning to see how much the estimated positions would improve.

Position Estimation with Orange Data Mining

One of the machine learning tools we used this time is Orange Data Mining. Orange Data Mining is an open source data mining tool developed and provided by the University of Ljubljana, Slovenia. Anyone can download and use it for free.
This tool allows machine learning to be executed without programming by combining various GUI modules including data import, model definition, prediction, and output to build process flows.

Here is a sample of the operation screen.

This time, we estimated the beacon positions using the k-nearest neighbor model (kNN) among many machine learning methods. In kNN, the data to become a teacher is collected in advance, and all the data is converted into numerical values. Next, when operational data (called "test data" in machine learning textbooks) is passed to kNN, each test data is classified into the closest teacher data, and the objective variables it has (here, the x and y coordinates of the teacher data) are returned.

The figure below is the plot of the estimated beacon positions returned by Orange kNN. Although it requires time and effort to create teacher data in advance, the error in the estimated position will be improved compared to the TCOT in Figure 1.

Main parameters specified in Orange kNN:

  • k: 1
  • Metric: Manhattan
  • Weight: Distance

Note:
kNN is an algorithm that classifies data based on teacher data. In this example, the data is classified into the objective variables (x, y coordinates) of the teacher. Therefore, even if the beacon is located at the coordinates (0.5, 0.5) in the above figure, the coordinates (0, 0) are the correct value algorithmically.

Position Estimation with scikit-learn

Next, let us move on to scikit -learn, an open source machine learning library for Python provided by Google.

Here, the k-nearest neighbor method (nearest neighbor method) is adopted as in Orange Data Mining. KNeighborsClassifier and KNeighborsRegressor are used as prediction model functions for beacon coordinates.

Position estimation with KNeighborsClassifier

KNeighborsClassifier function is a classification of the K-nearest neighbor method. KNeighborsClassifier is used to estimate the positions of the beacons by supervised learning. Labels (classification classes and objective variables) give multinominal classes of X and Y coordinates.

Parameter specifications:

nbrs = KNeighborsClassifier (n_neighbors=1, metric='manhattan', algorithm='brute', weights ='distance')
nbrs.fit (teacherData, teacherXYLabel)
prediction = nbrs.predict (testData)

Main parameters:

  • k: 1
  • Algorithm: brute
  • Metric: manhattan
  • Weights: distance

The plot result became almost the same as the result in Orange. However, while using the same kNN for Orange and scikit-learn, there were differences in the estimated coordinates of the individual beacons. It was a little surprising since we expected Orange and scikit-learn to return almost the same results due to kNN algorithm's relative simplicity. The reason for this may be the algorithm option called "brute" (brute-force search), which cannot be specified in Orange.

Position estimation with KNeighborsRegressor

Finally, let us use the KNeighborsRegressor function to estimate positions by supervised learning. The KNeighborsRegressor function is a regression analysis of the K-nearest neighbor method. Labels (classification classes and objective variables) give multinominal classes of X and Y coordinates.

Parameter specifications:

nbrs = KNeighborsRegressor (n_neighbors = 1, metric ='manhattan', algorithm ='brute', weights ='distance')
nbrs.fit (teacherData, teacherXYLabel)
prediction = nbrs.predict (testData)

Main parameters:

  • k: 1
  • Algorithm: brute
  • Metric: manhattan
  • Weights: distance

The plot result became the same as the KNeighborsClassifier function.

See also:
k-nearest neighbors algorithm
A Simple Introduction to K-Nearest Neighbors Algorithm

Future Challenges

We have been trying to estimate the beacon positions by using several methods. The parameters specified in the scikit-learn kNN function use the optimum solution obtained by GridSearchCV, but the accuracy of position estimation may be improved a little by improving the feature scaling. We have also tried neural networks (MLPClassifier), but have not gotten satisfactory results yet. In the near future, we would like to try other estimators including the MLP Classifier.

Before choosing the right estimator, however, we have noticed some terminals with large RSSI value swings while looking at the acquired data, and it seems that these swings have adverse effects on position estimation. Perhaps it is more important to consider some hardware approaches to reduce those fluctuations.

Varista

Varista is a machine learning tool that can be used on the web without programming. We tried the free trial once, however, we ended up putting it aside for the time being after failed attempts to upload the same teacher/test data explained above. At the end of last year, we casually contacted Varista on this upload issue and unexpectedly got a quick and proper solution to uploading data files. Finally, we were able to obtain the result of estimated positions in a CSV file. The figure below is the plotted data from the result file. 

Varista uses a decision tree-based algorithm with many configurable parameters. Although we used almost the default settings this time, the result was comparable to the above kNN. According to this result, it seems that decision tree-related algorithms are also promising in IPS.

Varista Expert screen-various parameters are available

Added on January 5, 2021
Varista does not seem to have an API. We assume some users would be more excited if there were an API that would return results immediately upon posting test data from the web.

Added on August 18, 2021
The Varista service policy has changed and now you need to send a request by email for a free trial, obtaining the price list, or signing up.

Sachiko Kamezawa

IPS Related Blog Posts

  1. IPS Application Templates for FileMaker ― QuickIPS ―*
  2. Indoor Mobile Position Monitoring Model with iBeacon/Raspberry Pi 1  ―  Overview*
  3. Indoor Mobile Position Monitoring Model with iBeacon/Raspberry Pi 2   ―  RSSI/Distance Calibration and Trilateration*
  4. Indoor Mobile Position Monitoring Model with iBeacon/Raspberry Pi 3 ― Enhancement of Two-Circles-Oriented Trilateration (TCOT) and Measurement Results*
  5. Estimate the approximate position of the beacon with a small number of receivers in a large area such as Tokyo Dome(Google translate)
  6. Improving IPS Positioning Accuracy with Machine Learning *
  7. TIPS for making IPS testbeds(Google translate)
  8. Object Tracking for Visualizing The Movements of People and Objects on a Map*
  9. Send Location Information via UDP - TPC_IPS/QuickIPS Extension*
  • * indicates that original article translation into English has been completed by TPC.
  • "Google translate" indicates that clicking it will Google translate the original article, and may be translated into English in the near future by TPC.

TPC's IPS Products

Indoor Mobile Position Monitoring Model with iBeacon/Raspberry Pi 3 ― Enhancement of Two-Circles-Oriented Trilateration (TCOT) and Measurement Results

Information

Our indoor positioning system TPC_IPS Ver1.0 was released on April 1, 2022.

We also plan to release IPS application templates "QuickIPS" and "TPC_IPS Web API" which allow interactions with external IPSs/RTLSs in the future.

In the previous post, Raspberry Pi terminals (hereinafter also referred to as terminals) placed in a grid pattern (in a square grid) measured the signal strengths (RSSI) of iBeacons (hereinafter also referred to as beacons) , and calculated the beacon positions by a method called "Two-Circles-Oriented Trilateration."

In this post, this "Two-Circles-Oriented Trilateration" will be extended to allow terminals to be placed freely, not just limited in square grids for improving cost performance (cost per measurement precision), and to arrange terminals according to conditions of facilities and locations for system installation.

Overview of The Previous Two-Circles-Oriented Trilateration

The Two-Circles-Oriented Trilateration (hereinafter referred to as the old version) in the previous article calculated the distances (radii) between the terminals and the beacon based on the measured RSSI values of the beacon (B in the Figure 1), where
the terminals were arranged in a square grid (A to I in Figure 1). The distance (= radius) between the beacons was calculated. Trilateration ordinarily fails if the three circles in question do not overlap; however, this positioning model can assume the position of the beacon (B) by calculating the x coordinate using circle C1 and circle C2 (E and F respectively in the figure), and the y coordinate using circle C1 and circle C3 (E and B respectively in the figure).

Figure 1: Two-Circles-Oriented Trilateration (Old Version) Overview

For more information on Two-Circles-Oriented Trilateration, please read the previous article.

Enhancement of Two-Circles-Oriented Trilateration (TCOT)

One of the problems with the old version was that the terminals always had to be arranged in a square grid, and it was assumed that each terminal involved in positioning existed horizontally and vertically. This leads to maintenance and cost issues.
Therefore, we tried to enhance the previous Two-Circles-Oriented Trilateration so that the arrangement of terminals would be more flexible. Hereinafter, this enhanced version may be called TCOT.

TCOT Overview

This section describes TCOT. Figure 2 below shows one terminal always stays in the center of each square in Figure 1. Suppose the terminals that detect the beacon (B) at the shortest distance are E (circle C1), K (circle C2), B (circle C3) out of the thirteen terminals (A to M) in the order of detecting the beacon (B) from the shortest distance.

Now, please take a closer look at the circles C1 and C2 (Two-Circles Orientation). The previous model with a square grid without having a terminal in each square calculated only the x-axis (the horizontal axis) based on the circles C1 and C2. This new method does not expect the circles C1 and C2 to be placed vertically, so it is still too early to determine the x-axis at this point.
Instead, the blue area where the circles C1 and C2 intersect is used as a candidate for the beacon position. The circle C3 and its radius then locate the beacon within the blue area. Since the circle C3 does not reach the light blue area, the point closest to the circle C3 in the light blue area is determined as the position of the beacon.
The general idea of TCOT is that the circles C1 and C2 determine the candidate area, and then the circle C3 determines the final coordinate from that area.

Figure 2: The enhanced version of Two-Circles-Oriented Trilateration (TCOT)

Grid type

The terminal layout is called a grid or grid type.

Figure 3: Grid type


"Square + center type" aims to improve positioning accuracy while suppressing the increase in terminals. For example, if the 16m "Square type" does not provide satisfactory positioning accuracy, changing to an 8m grid would become costly and difficult to maintain. Instead, adding a terminal to the center of each square will improve the positioning accuracy.

The "Triangle" grid is used according to the shape of the location for system installation.

TCOT supports the "Square + center type" and the "Triangle type", but it is not limited to one grid type and is designed so that terminals can be arranged freely.
The Triangle type will not be covered in this post.
Before presenting the measurement results of TCOT, here is the overview of the system structure for the test we conducted this time.

System Structure Overview

product name explanation
iBeacon Aplix MyBeacon® Pro MB004Ac-DR2: 50 units (including fixed beacons for calibration)
Raspberry Pi Zero W/WH (receiver) Small computers: 13 units as receiving terminals for signals emitted by iBeacon. See node.js.
SQLite 3 Database.  See node.js.
Python 3/sym.py Based on the information recorded in the database by the development platform Raspberry Pi, we have developed a program that executes Two-Circles-Oriented Trilateration (TCOT).
node.js
  • Development platform. Develop a program that receives signals from iBeacon, processes them, and stores them into the database. This is a resident program on each Raspberry Pi and runs the above processes upon request from clients such as PCs.
  • Develop a program for plotting the position information of Raspberry Pi's and beacons with plotly. This is a resident program on the server and run the above process upon request from Web clients such as PCs.
plotly.js See node.js.
Fabric A tool for running commands from clients such as PCs against multiple Raspberry Pi terminals (thirteen in this test) all at once.

Measurement Test Results

Photo 1: Measurement test site

This time, we conducted measurement tests on the above-mentioned grid types, targeting the "Square type" and the "Square + center type", with grid widths set to 4m, 8m, 16m, and 32m* respectively.
The old version of Two-Circles-Oriented Trilateration was applied to the "Square type", and the TCOT of Two-Circles-Oriented Trilateration was applied to the "Square + center type".
The old version measured 41 beaconss, and TCOT measured 37 beacons. The reason why the number is different between the old version and TCOT is that TCOT required four additional beacons (fixed beacons) for calibration.

The two figures below show the results with numerical and graphical representations of the values ​​related to the errors between the actual coordinates of the beacon and the measured coordinates.

The actual position coordinate of each beacon and the measured coordinate error (distance error) are calculated by the following formula:

Distance error = | actual_x --estimated_x | + | actual_y --estimated_y |

actual_x and actual y are the actual coordinates of the beacon, and estimated_x and estimated_y are the coordinates calculated by the system. A value of 0 indicates that the actual and measured coordinates exactly match. The error of each beacon is calculated, and the average value(Error Ave), the maximum value (Error Max) , and the error rate are shown. The minimum value is approximately 0 for both the old version and TCOT, so it is omitted.

The error rate (Error rate) is obtained by the following formula:

Error rate = Error Ave / (Grid distance * 2)

This value is calculated by dividing the average value of the error by the grid distance (horizontal + vertical). The smaller this number is, the more accurately the beacon position is calculated compared to the grid distance.

Figure 4: Distance errors of the old version: Square + center type with 9 terminals

*The data for the 32m grid was generated from the 16m grid data.  The coordinates were calculated using only the data from five terminals except for the terminals B, D, E, F, and H.

Please note that the figure above uses the old version of Two-Circles-Oriented Trilateration.

The error rate decreases (improves) as the grid width increases, but increases (worsens) on the 32m grid. This suggests that when the distance between the beacon signal and the terminal is about 30m, the RSSI, which is originally low in accuracy, deteriorates further in this test environment.

Figure 5: Distance errors of TCOT: Square + center type with 13 terminals


* The data for the 32m grid was generated from the 16m grid data.  The coordinates were calculated using only the data from five terminals except for the terminals B, D, E, F, H, J, K, L, and M.

Please note that the figure above uses an enhanced version of TCOT for Two-Circles-Oriented Trilateration.

The measurement accuracy is improved by the Square + center type with TCOT (ver01) positioning than by the Square type with the old version.

The figure below is a graph comparing the old version and TCOT (ver01 in the figure). 

The red line shows the improvement rate. You can see that TCOT (ver01) is improved by 15% to 30% or more compared to the old version.

Individual Plot

The following table contains plot result files of the beacon positioning data generated by TCOT mentioned above. Unlike the conventional trilateration, TCOT calculates the position coordinates even if the three circles do not intersect, and the following plot files are visual representations of the TCOT results.

Two-Circles-Oriented Trilateration version
(TCOT ver.)
Grid type
(Grid type)
Grid size
(Grid size)
Download
(Download)
Old version (Old) Square 4m x 4m 4mGrid_R9I_old.pdf
Old version (Old) Square 8m x 8m 8mGrid_R9I_old.pdf
Old version (Old) Square 16m x 16m 16mGrid_R9I_old.pdf
Old version (Old) Square 32m x 32m 32mGrid_R9I_old.pdf
TCOT (ver01) Square + center 4m x 4m 4mGrid_R13c_ver01.pdf
TCOT (ver01) Square + center 8m x 8m 8mGrid_R13c_ver01.pdf
TCOT (ver01) Square + center 16m x 16m 16mGrid_R4Ir_ver01.pdf
TCOT (ver01) Square + center 32m x 32m 32mGrid_R5c_ver01.pdf

Batch Plot of All Beacons (Added on 2020/7/27)

Unlike the individual plots above, the following batch plots show the actual positions of all beacons and the estimated positions calculated by TCOT. TCOT has features including the individual plot and the batch plot of all beacons.

Legend: In the representation● -> ●,  the source of the arrow () indicates the actual beacon position, the target of the arrow () indicates the estimated position. () indicates the fixed beacon for calibration.

TPC_IPS (Protoype)

We have been developing an indoor positioning prototype called TPC_IPS to automate the above tests. TPC_IPS is roughly divided into two modules: FetchB and TCOT.

Fetch B

FetchB is placed on the application server and lets Raspberry Pi terminals (receivers, RPs) to scan beacon signals, and stores the data including UUIDs and RSSI values acquired by the RPs into the database.

FetchB is capable of running commands against many RPs in one go.

TCOT

TCOT calls up FetchB to extract the beacon information stored in the database, calculates coordinates based on the above-mentioned Two-Circles-Oriented trilateration, and eventually outputs or plots the result coordinates of each beacon.

TPC_IPS's TCOT module is described in the following video.

Naoki Tsuchiya

IPS Related Blog Posts

  1. IPS Application Templates for FileMaker ― QuickIPS ―*
  2. Indoor Mobile Position Monitoring Model with iBeacon/Raspberry Pi 1  ―  Overview*
  3. Indoor Mobile Position Monitoring Model with iBeacon/Raspberry Pi 2   ―  RSSI/Distance Calibration and Trilateration*
  4. Indoor Mobile Position Monitoring Model with iBeacon/Raspberry Pi 3 ― Enhancement of Two-Circles-Oriented Trilateration (TCOT) and Measurement Results*
  5. Estimate the approximate position of the beacon with a small number of receivers in a large area such as Tokyo Dome(Google translate)
  6. Improving IPS Positioning Accuracy with Machine Learning *
  7. TIPS for making IPS testbeds(Google translate)
  8. Object Tracking for Visualizing The Movements of People and Objects on a Map*
  9. Send Location Information via UDP - TPC_IPS/QuickIPS Extension*
  • * indicates that original article translation into English has been completed by TPC.
  • "Google translate" indicates that clicking it will Google translate the original article, and may be translated into English in the near future by TPC.

TPC's IPS Products