Our indoor positioning system TPC_IPS Ver1.0 was released on April 1, 2022.
We also plan to release IPS application templates "QuickIPS" and "TPC_IPS Web API" which allow interactions with external IPSs/RTLSs in the future.
Our indoor positioning system, TPC_IPS, analyzes beacon signals using a positioning engine (TCOT) on the application server and stores the calculated location information of each beacon in a database. Users access the database from client machines in a timely manner to retrieve location information, which is then used in front-end applications such as floormaps. This is a Pull method in which the client requests information from the server.
The drawback of the Pull method is that it generates extra queries and increases the server load as the number of clients increases.
On the other hand, there are systems which uses the Push method that send data from the server side to the client. This time, we implemented a process to automatically update the client's floormap by broadcasting the location information calculated by TPC_IPS's location positioning engine (TCOT) to the network via UDP.
The module configuration between server and client is illustrated below.
A program called tcot_sender.py resides on the server, which calls TCOT to obtain location information, which is then broadcast via UDP using python sockets.
On the client, tcot_receiver.py listens for the above UDP and performs necessary tasks such as data processing when it receives UDP data.
QuickIPS is a front-end application and it displays the latest locations of beacons on the floormap. QuickIPS is developed in FileMaker, however, FileMaker itself unfortunately does not have socket communication capabilities, it cannot directly retrieve data from tcot_receiver.py.
Therefore, to enable socket communication between tcot_receiver.py and QuickIPS, we prepared a file called tcot_listener.html and embedded this html file in a Web viewer * on the floormap layout. tcot_listener.html creates a WebSocket and uses addEventLisner to wait for incoming data from tcot_receiver.py. Upon detecting incoming data, it calls up PerformScript() to run a FileMaker script to update the QuickIPS floormap.
*Web viewer is a feature that displays web pages directly in the FileMaker Pro layout.
This mechanism is not only available in FileMaker, but also in common web applications.
Below is a summary of the pros and cons of the UDP Push method we have implemented.
Pros
Faster data transfer than TCP communication
Reduced server load, especially when there are many users
System configuration flexibility
Real-time performance (less overhead, faster execution of client apps)
Cons
Compared to TCP communication, data loss (packet loss) may occur because transmitted data is not guaranteed
Processing of connection confirmation and data reception confirmation for UDP communication can be troublesome
注: TPC_IPS ver1.0 does not support UDP Push. We plan to address this issue in future releases, but specifications are subject to change without notice.
* indicates that original article translation into English has been completed by TPC.
"Google translate" indicates that clicking it will Google translate the original article, and may be translated into English in the near future by TPC.
Our indoor positioning system TPC_IPS Ver1.0 was released on April 1, 2022.
We also plan to release IPS application templates "QuickIPS" and "TPC_IPS Web API" which allow interactions with external IPSs/RTLSs in the future.
An IPS commonly includes a function called "object tracking," which is the ability to track and visualize the movement of people and objects (hereinafter this feature is called "object tracking"). The following figure is a sample of our object tracking using our products TPC_IPS and QuickIPS, and shows a two-dimensional map on the X and Y axes and time on the Z axis. The blue and orange lines indicate the positions of objects at different timestamps. For example, we can see that orange line (bcn0-5) was at the coordinates (0, 6) at 13:37:58.
This 3D graph can be rotated on the PC screen, so it is also possible to visually determine if the red and the blue are in contact or close proximity.
Note:
This object tracking feature is under developemnt as of April, 2022. We plan to include object tracking in the future releases of our products TPC_IPS and QuickIPS.
Specifications are subject to change without notice.
movements of objects with time sequence in 3D representation
Purposes
Object tracking is a function that displays the movement of people and objects on a map along with a time sequence, and can be displayed in 2D or 3D format. This is useful for accurately identifying the actions and movements of infectious disease carriers, visitors at a store, transport machines, employees, etc.
the movements of people and objects on on 2D map with the time sequence
Tools and Applications Used for Object Tracking
The tools and applications used in QuickIPS are as follows:
Tool/Application
Purpose
Python, matpotlib, etc.
2D/3D representation
pyodbc, ODBC, etc.
issues sql queries to the database from Python, retrieves the properties such as coordinates, timestamps, and then send them to matplotlib.
FileMaker Pro Note: mandatory for QuickIPS.
object tracking is available from the command line prompt. QuickIPS has the GUI to issue this Python command.
Specifications
locations of objects with time sequence in 2D and 3D representations
The Z-axis represents time in 3D.
The following parameters are available on the QuickIPS GUI:
parameter
purpose
time range
specify the period for object tracking in twelve digit codes
2D/3D
select 2D or 3D tracking
plotting formats
select to show the tracking result image either in the QuickIPS Web viewer or in a separate Python-matplotlib window.
beacons
multiple beacons can be selected from the QuickIPS picker interface.
How to Use
Specify the range of timestamps for object tracking in [time] on the QuickIPS Window in 12-digit codes (YYYYYMMDDHHMMSS, which is the date and time the object coordinates were measured).
Choose where you want to see the object tracking result in [Plot in...]. If you choose [QuickIPS], you will see the tracking result in the QuickIPS Web viewer; if you choose [Separate window], you will see the tracking result in a separate Python-matplotlib window. In the following example, [QuickIPS] is selected.
Use Picker icon to choose beacon(s) to track. The example above shows the two beacons chosen: bcn2-8 and bcn0-5.
If you want to see the 2D tracking result, choose [2D] and click Tracking button . Then, you will see the tracking result of the two beacons specified, along with the routes and timestamps.
If you chose [Plot in...] in step 2 above, you would see the tracking result in a separate Python-matplotlib window as follows:
movements of people and objects are shown in 2D map along with timestamps
In this window, you can zoom in and zoom out the floow map to check out the details.
3D Object Tracking
If you want to see the object tracking result in 3D, first choose [3D] in the radio button in step 4 above, and then click Tracking button . If QuickIPS is selected in [Plot in...] at this moment, you will see the tracking result in the Web viewer in the same window.
mouse operation not allowed for the image in Web viewer
If "Separate window" was chosen in [Plot in...] at this monent and if you click Tracking button , you will see the 3D tracking result in a separate Python-matplotlib window.
You can rotate, zoom in, and zoom out this image by using your mouse or operation icons in the window. You can see how it works in the following video clip.
* The specifications of QuickIPS and object tracking are subject to change in the future.
* indicates that original article translation into English has been completed by TPC.
"Google translate" indicates that clicking it will Google translate the original article, and may be translated into English in the near future by TPC.
Our indoor positioning system TPC_IPS Ver1.0 was released on April 1, 2022.
We also plan to release IPS application templates "QuickIPS" and "TPC_IPS Web API" which allow interactions with external IPSs/RTLSs in the future.
This post describes "The Indoor Mobile Position Monitoring Model" that Raspberry Pi terminals (hereinafter referred to as "terminals" or "monitoring terminals") scan beacons and calculate the positions of the beacons. This model has various names including "Indoor Positioning System," "Asset Management System," " Indoor Location (Tracking) System," "Indoor Positioning System (IPS)," "Asset Tracking System," "Real-time Location System(RTLS) ," and so on, depending on vendors and system purposes. This blog mainly uses IPS as a term to describe this model.
Related posts (in Japanese) on Fixed Beacons Monitoring Models:
The system model for mobile positioning can be divided into submodels depending on their required attributes.
Request attribute
Attribute description
value
Number of positioning targets
Whether there are many or few positioning targets
Few | Many
Movement frequency
Movement frequency of positioning target
High frequency | Low frequency
Moving Speed
Moving speed of positioning target
High speed | Low speed
Positioning accuracy
Required positioning accuracy
High precision | Low precision
Real-time
Time from positioning request to actual positioning
Real-time | Non-real-time * 1
Positioning target
Things to be positioned
Beacons | Mobile terminals
App device
Device for displaying positioning results
Management terminals | Mobile terminals * 2
* 1: Non-real time allows a time difference of up to about one minute.
* 2: Management terminals can be mainly PCs and mobile phones.
The submodels include the following scenarios:
Displays the player's own position and other players' positions on the player's smartphone in indoor games.
Attributes: Few | High frequency | Fast | High precision | Real-time | Mobile terminals | Mobile terminals -> Indoor GPS model
Displays the positions of players on the PC and the like in indoor sports such as hockey.
Attributes: Many | High frequency | High speed | High accuracy | Real-time | Beacons | Mobile terminal -> Hockey model (Video of Quuppa, Finland)
Staff grasp the positions of patients and residents in hospitals and nursing homes. Attributes: Many | High frequency | Low speed | Low accuracy | Non real-time | Beacons | Management terminasl -> Hospital model
Manags the positions of products in factory assembly lines. Attributes: Many | High frequency | Low speed | Low precision | Non real-time | Beacons | Management terminals -> Factory process model
Detects the positions of products in warehouses and storage. Attributes: Many | Low frequency | Low speed | Non real-time | Beacons | Management terminals -> Warehouse model
IPS specifications and operation methods also vary depending on the submodel.
Our TPC_IPS under development targets the above 3 to 5 submodels.
A lot of drones on the market are equipped with GPS to track their positions of themselves outdoors; however, GPS does not work indoors, near buildings, valleys, etc. where GPS signal reception is poor or unavailable. In such cases, using an IPS can be an option to track the positions of drones and control the flight. This allows program-controlled drones to transport goods, patrol and take photographs in unmanned buildings and factories late at night.
However, IPS using iBeacons (BLE4 beacons) may cause huge positioning gaps of 1 meter or more, so it would be difficult to control drones in offices.
In this respect, a system using BLE5.1AoA compatible beacons or Ultra Wide Band (UWB) tags will be more effective because the positioning gap can be narrowed down to 1 m to 10 cm.
When applying an IPS, it is important to determine how much positioning accuracy the system can achieve.
The figure below shows a example that divides the area to be monitored into grids, places monitoring terminals (Raspberry Pi's, painted in pink in the figure) at the corner of each grid, and scans the beacon signals in the area. The blue marks in the figure describes beacons. These beacons are attached to mobile objects such as things and people. The distance between the Raspberry Pi's, that is, the length of the sides of each grid, should be smaller in places with many obstacles and people, or in environments where high positioning accuracy is required. On the contrary, the distance could be larger in places where there are few obstacles and people, or in environments where positioning accuracy is not important, and the number of terminals can be reduced.
[Fig. 1: Arrangement of Raspberry Pi monitoring terminals]
It is often impossible to place monitoring terminals in grids in a production environment.
Each Raspberry Pi keeps receiving beacon signals and sending the information to the application server; the server performs trilateration and calculates the position of each beacon based on the collected data.
There are multiple methods for calculating the positions of beacons, and we use trilateration this time.
All monitoring terminals (Raspberry Pi1 to Pi16) in Figure 1 are constantly reading (scanning) the beacon signals. Beacon signals have the strongest strength when they are issued; however, they will be attenuated according to the distance as they propagate through space. Since each Pi obtains the signal strengths and RSSI (Received Signal Strength Indication), the distance between the beacon and the terminal (Pi) is calculated from the degree of attenuation of the RSSI.
In the "Before" section of the figure below, there are circles centered on the terminals Pi2, Pi5, and Pi6, and the radius of each circle is the distance to the beacon. Trilateration estimates that the position of the beacon is at the point where the circles Intersect, or in the center of the area where those three circles overlap. Terminals other than Pi2, Pi5, and Pi6 also detect this beacon; however, Pi2, Pi5, and Pi6 are the closest three terminals so the accuracy will be higher. Therefore, trilateration is performed based on these three circles.
Next, suppose this beacon moves to the "After" position. Due to the movement, the terminals with the shortest distance are Pi12, Pi15, and Pi16. At this time, trilateration is performed using the circles of these closest terminals (distance between the terminals and the beacon).
At first glance, the positions of beacons seems to be easy to identify, but it is difficult to achieve the desirable results. The reasons are as follows:
RSSI can measure the distance with reasonable accuracy when the distance between the terminal and the beacon is several tens of centimeters, but if it exceeds 1m, it is strongly affected by multipath (multipath propagation) or other factors, and the signals will not be attenuated as officially stated. It happens very often that the distances calculated based on RSSI are far from the actual distances.
As mentioned above, the distance based on RSSI is unreliable. Also, trilateration often fails since three circles do not intersect as expected. In such a case, alternative positioning methods should be applied instead of concluding it as a trilateration error.
In the next post, we will actually measure RSSI and consider the calculated distance error between the terminal and the beacon in question, and the difference from the actual distance. In addition, we will also describe our original RSSI/distance calibration method and the expansion of trilateration.
This post was originally published in April 2018, and since then new products and technologies have been released. We also keep developing and testing new methods. Here are some pieces of information to share before closing up this post:
The next post (published on August 9, 2018) and the next post (published on July 12, 2019) describe the results of developing, testing, and verifying a prototype for RSSI, distance calibration, and trilateration. However, the positioning accuracy of trilateration based on RSSI And RSSI has its limit. In this respect, positioning using machine learning can improve the positioning accuraty compared to trilateration, although machine learning requires additional time and effort for learning. We also posted an article on December 26, 2020, regarding the positioning accuracy by machine learning, after creating a prototype system, testing and verifying it.
Specifications Of BLE5.1 The AoA / AoD were announced in January 2019. This makes it possible for BLE5.1 compatible terminals (sensors) to acquire the direction (angle) where the beacon exists, in addition to the distance of the beacon itself. It is expected that the positioning accuracy will be narrowed down to 1m or less. However, even though more than two years have passed after the specifications were released, major vendors have not yet released BLE5.1 compatible transmitters and receivers (sensors).
At the end of April 2021, Apple released AirTag. iPhone 11/12 can can now perform AirTag positioning with high accuracy. The technology used for this positioning is called UWB, which is said to be capable of positioning with an error of 10cm. IPS's using UWB such as Ubisense and Zebra have been on the market for quite some time and have been having high reputations, however, they are quite expensive. Overseas IT-related media call AirTag "Game Changer," and it is expected that new IPS's using UWB will appear on the market in the near future.
* indicates that original article translation into English has been completed by TPC.
"Google translate" indicates that clicking it will Google translate the original article, and may be translated into English in the near future by TPC.
We have been developing a system called TPC_IPS. In a nutshell, IPS (Indoor Positioning System) can be described as an indoor GPS; a system that grasps the positions of people and things indoors. If the environment is indoors or underground, positioning is impossible with satellite technology like GPS, and positioning accuracy will not be satisfactory, so IPS performs indoor positioning. IPS is also one of the IoT (Internet Of Things) technologies.
[IPS/Asset Tracking System Overview]
The image above is an overview of IPS in a warehouse. Transmitters called beacons or tags are attached to people or things, the receiving terminals () read the signals () emitted by those beacons, and finally the computer analyzes the signal information in order to measure the positions of individual beacons. This positioning information can be referenced by internal or external users via the LAN/WAN. Such an IPS that administers many things as shown in the image below is sometimes called an Asset Tracking system.
The following figure is an IPS configuration example. In this example, the IPS is divided into two subsystems: Positioning and User Application. Positioning literally calculates the coordinates of individual beacons. As of May 2021, our product TPC_IPS, uses BLE4 beacons for positioning; however, UWB which was recently adopted by AirTag is gaining attention. USB products for IPS/Asset Tracking which are not limited to mere lost-and-found tags are expected to appear on the market in the upcoming years.
Note:
UWB IPS products such as Ubisense and Zebra have been available from some time ago, however, only some large companies have adopted them because they are quite expensive. The advent of AirTag and SmartTag may contribute to the widespread adoption of low-cost UWB IPS.
We have already posted the positioning using TPC_IPS before (see the link at the end), so in this article we are going to give you an overview of our -QuickIPS- user application template using FileMaker.
Note:
QuickIPS will be bundled with TPC_IPS. The standalone version will be released later this year.
* QuickIPS specifications and schedule are subject to change without notice.
[IPS configuration diagram]
Note:
The above diagram shows how a server computer performs positioning of beacons and tags attached to objects. This method is used for Asset Tracking (or Asset Management). Another way to achieve indoor positioning in a more GPS-like fashion is for a mobile app (device) to track its own position within a grid of fixed beacons and tags.
The previous diagram describes the flow that each beacon or tag sends its information to the server computer, the server computer calculates the location information based on the collected information, and the database stores the result location information along with the beacon IDs (or tag IDs).
Furthermore, the user application accesses the location data in the database to process the data according to user's preferences, and display the results on the computer or the smartphone. The following are three typical user applications.
Floor map - displays the positions of people and things on a floor map
Heatmap - displays the degree of congestion of people
Motion tracking - represents the consecutive movements of a person or a thing as a line
Of these, 1 and 2 can be developed in FileMaker alone. QuickIPS is a user-customizable template that implements these two.
The object tracking feature will be included in future versions of QuickIPS and TPC_IPS. Please read this post in out blog for more information on object tracking.
The reason is simple. FileMaker requires less man-hours than other tools to create a graphical application. FileMaker is also suitable for prototyping IPS user applications. The following is a detailed introduction to the QuickIPS features.
The figure below is a floor map that displays the beacon positions using FileMaker's scatter graph feature. A map (an image file) for plotting location information is imported in the background of the FileMaker layout in advance, and a scatter graph is placed over the map.
The advantages of this method are rounding coordinates data (described later) is not required, and it is easy to create; however, this map also has disadvantages such as the beacon names may overlap when multiple beacons are detected in close proximity, and detailed beacon information cannot be desplayed.
The beacon names overlap when multiple beacons are detected.
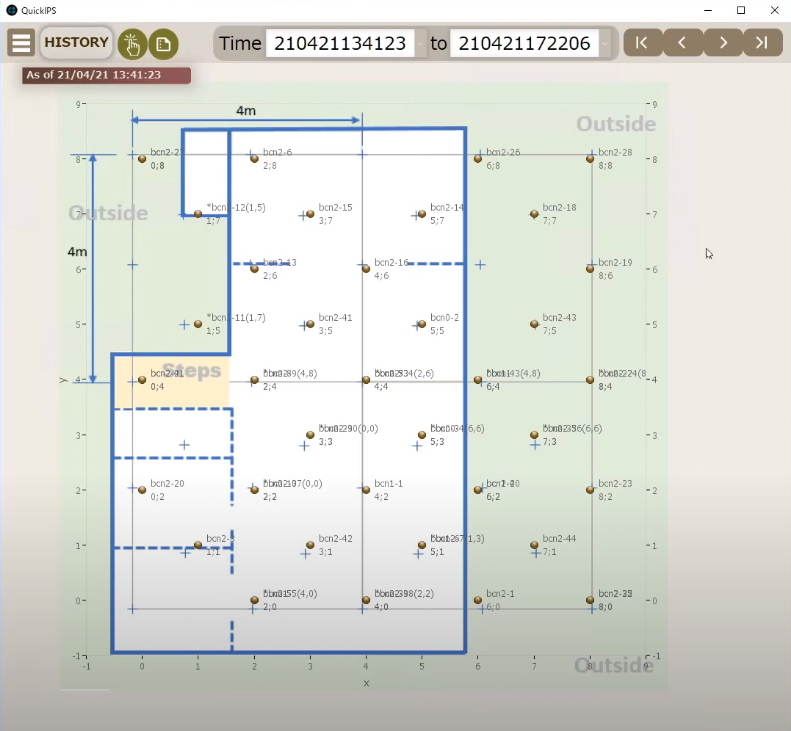
In this method, SVG spot icons () and beacon information objects are placed at the coordinates (fixed point coordinates) predetermined by the user, whereas the information of the positioned beacon is displayed by these beacon information objects.
Unlike the scatter graph method, you can fine-tune this feature; multiple beacons on the same coordinates can be displayed, while those beacons which positions are different from the actual coordinates can be displayed in red, and the display font size can also be changed (using ◀ A ▶).
TPC_IPS's Positioning feature can calculate the beacon coordinates by rounding the measured coordinates to the fixed point coordinates.
However, if you wish to use QuickIPS with an external system, you need to do this rounding on the external system.
Example:
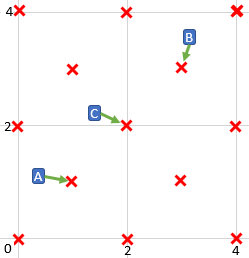
You have set the fixed point coordinates ( x ) as shown in the figure below. Then, the external system detects the beacons as follows. The x and y coordinates are shown in parentheses.
<Positioning coordinates by the external system>
Beacon A (0.2, 1.1)
Beacon B (3.2, 3.6)
Beacon C (1.5, 2.1)
Suppose the closest fixed point coordinates (x) to each positioning coordinate are determined as the coordinate of each beacon (this is the rounding process). In this example, beacon A (0.2, 1.1) is rounded to the fixed point coordinate (1,1), beacon B (3.2, 3.6) is rounded to (3, 3), and beacon C (1.5, 2.1) is rounded to (2, 2) respectively.
Note:
You may code your own program to find the closest fixed point coordinates (the nearest neighbor points), but if you can use K-nearest neighbor (k = 1) libraries, you can achieve it quite easily. It may be possible to create a knn custom function in FileMaker and apply it to the rounding process when retrieving data from an external database, however, it will be quite difficult.
Even that famous Brian Dunning's custom function publishing site has not shared any knn custom functions so far.
TCOT (Two-Circle Oriented Trilateration), the positioning algorithm in TPC_IPS, calculates the coordinates with a trilaterational approach, so that the raw positioning coordinates do not almost always match the fixed point coordinates. For this reason, when executing TCOT, KNeighbors of scikit-learn provides an option to round to fixed point coordinates.
By nature of trilaterational approaches, there is a certain degree of errors from the fixed point coordinates. To correct such deviations, we provide an option to use the KNeighbors algorithm of scikit-learn to round coordinates to the closest fixed coordinates during the TCOT process.
Error graph displays the errors between the actual coordinates of the beacons in a stationary state and the positioning coordinates as a line graph. This feature is useful for positioning system engineers to check the accuracy of positioning.
The horizontal axis is the scanning time, the vertical axis is the error; the smaller the error value, the higher the positioning accuracy.
When the beacons to be displayed on the graph is selected from the picker floating window (described later), the positioning error is displayed on the vertical axis within the time range specified by [Time].
During the test before operating an IPS, this feature becomes useful for checking whether the positioning accuracy that suffices the operation. In addition, the accuracy of positioning varies due to changes in the indoor environment, so use this feature in a timely manner to check the positioning accuracy.
Note:
When the automatic update button ● is running in AUTO mode, or the update button is clicked in MANUAL mode, the error graph is updated with the latest positioning information.
QuickIPS has three operational modes: AUTO, MANUAL, and HISTORY. Each mode is selected from the pull-down menu by clicking "Execution mode" in the figure below.
AUTO Mode
● button will be displayed in the upper right corner of the screen. Click it to automatically update the Floor map, Heatmap, and Error graph with the latest data. Click ■ to stop automatic update.
MANUAL Mode
This mode, unlike AUTO mode, does not update the information automatically. To update with the latest information, click displayed in the upper right corner of the screen.
HISTORY Mode
In this mode, Floor map, Heatmap, and Error graphs can be displayed based on the past coordinate data.
This section explains how to use the header part at the top of the screen.
Submenu button
Click to display the pop-up menu. Select from the following menu items:
Scatter map (floor map using scatter graph)
Floor map (floor map using objects)
Heatmap
Error graph (distance error graph)
Execution mode
Select from AUTO, MANUAL, and HISTORY described earlier.
Time
Specify the range of ScanCode (date and time when the scan was executed in YYMMDDMMDDSS format).
Note:
ScanCode is automatically generated by TPC_IPS.
ScanCode navigation
Buttons for moving/selecting between ScanCodes within the range specified in [Time]
| <: Move to first
>: Move to next
<: Move to previous
> |: Move to last
Picker button
Display a picker/floating window (described later) for selecting the target beacon and ScanCode.
Error summary button
Display the error summary floating window (described later) that displays the details of the positioning error.
This window is used for selecting the target beacon(s) and ScanCode in the Floor map, Heatmap, and Error graph. This window is always in the foreground until it is closed with the x button.
Beacon list
List of beacons. Click to select or deselect. The selected beacons are displayed in pink. The selected beacons will be displayed on the Floor map. Up to six beacons can be displayed in the Error Graph.
Beacon name format
Click to switch the format of the beacon name displayed on the floor map. Name: Display only beacon name MM/Name: Display Major-Minor and beacon name
All button
Select all beacons
None button
Deselect all beacons
ScanCode list
A list of ScanCodes within the range specified by [Time]. Click to select and the floor map and heatmap will be displayed based on the coordinate data with that ScanCode.
The error summary floating window displays a summary of the positioning errors of the selected beacon(s) from the picker floating window. The line chart of the error graph can display up to 6 beacons at a time, but there is no limit to the number of beacons that can be selected in this summary.
This window is always in the foreground until it is closed with the x button.
Positioning error summary
The positioning error of the beacons in the stationary state is displayed for each beacon. Displays the average, maximum, minimum, and standard deviation of the positioning error of the beacon selected from the beacon list. The last line shows the aggregated value of all selected beacons. The aggregation target is the time range specified in [Time].
Error type
The buttons for selecting the type of error and the error calculation formula when each button is selected are as follows:
Distance: Sqrt((ax - ex)^2 + (ay - ey)^2)
Coordinates: Abs(ax - ex) + Abs(ay - ey)
Note:
・ ax, ay: feal coordinate x, y
・ ex, ey: positioning coordinate x, y
Two types of Floor maps, Heatmap, and Error graph features are also available on iPhone/iPad (iOS). These screens use the same screens as those for PCs, so that cost-effective development will be possible.
QuickIPS on iPhone
You need to take an extra care on PC/iOS representation when developing an IPS application
QuickIPS has a table called locLog that stores coordinates data; the data in locLog is retrieved and processed for the QuickIPS features described earlier.
If the database on the external system has a table or view that is compatible with locLog, then the data can be imported into locLog table for QuickIPS.
When using QuickIPS with an external database other than TPC_IPS, create a table based on the QuickIPS locLog table schema.
Field name
Data type
Input
Remarks
uuid
text
Mandatory
Beacon uuid
major
numeric
Mandatory
Major assigned to the beacon
minor
numeric
Mandatory
Minor assigned to the beacon
beaconName
text
Beacon name, required for displaying beacon information
x
numeric
Mandatory
X coordinate of the positioned beacon
y
numeric
Mandatory
The y coordinate of the positioned beacon
actual_x
numeric
The actual x coordinate of the beacon [Note 1]
actual_y
numeric
The actual y coordinate of the beacon [Note 1]
scanCode
numeric
Mandatory
12-digit number representing the scan time stamp (YYMMDDHHMMSS) [Note 2]
timestamp
timestamp
Date and time the record was created
Note:
actual_x and actual_y are the coordinates of the actual beacon used during the positioning accuracy test. The positioning error is calculated using these values and the measured coordinate values.
When using QuickIPS, a scanCode generated for each scan is required. When generating scanCode on an external system, make sure that each sensor executes the scan at the same timing, and set the same value (YYMMDDHHMMSS) to scanCode for each scan. For example, when the beacon/tag signal is scanned at 2022/1/1 0:0:0, "220101000000" is stored to the scanCode of each record on the server etc. regardless of the clock of the sensor/receiver.
The floor map using objects mentioned earlier can be customized as described in the figure below.
SVG spot icons and the beacon information objects (painted in pink in the figure for visibility, but they are actually transparent) have coordinate attributes respectively, so they need to be placed according to the coordinate attributes. For example, the object of the coordinate (2, 8) needs to be placed at coordinate (2, 8) on the floor map.
When creating a floor map for a large facility, the floor map image needs to be splitted, so that those floor map images will be imported on the newly created multiple layouts, tabs, and slides respectively.
QuickIPS will be released separately from TPC_IPS as a FileMaker template.
* QuickIPS specifications and schedule are subject to change without notice.
* indicates that original article translation into English has been completed by TPC.
"Google translate" indicates that clicking it will Google translate the original article, and may be translated into English in the near future by TPC.