Information
Our indoor positioning system TPC_IPS Ver1.0 was released on April 1, 2022.
We also plan to release IPS application templates "QuickIPS" and "TPC_IPS Web API" which allow interactions with external IPSs/RTLSs in the future.
The previous post (April 10, 2018) described the overview of indoor mobile positioning model. The purpose of this model is to attach iBeacons (hereinafter referred to as "beacons") to a large number of mobile objects and people in environments including warehouses, facilities, and factories, and to grasp the positions of those objects and people.
Figure 1
The terminals shown in pink dots in the figure detect the signals from one beacon shown in blue rectangles and calculate the distances based on the RSSI values (described later) of the individual signals. The distance between the terminal and the beacon is the radius of each circle. Since each terminal can only calculate the distance (radius) to the beacon, the position of the beacon is calculated based on the distance data of multiple terminals. When the beacon moves, the three terminals with the smallest radii (the nearest TOP3) would change, so the position (see "After") of the destination will be calculated based the distance data of those changed terminals: Pi12, Pi15, and Pi16 in the figure.
This post is going to describe our test conducted on RSSI, which is the key to calculating beacon positions.
RSSI (Received Signal Strength Indicator) is a numerical value that indicates the strength of the signal emitted from a beacon, and the strength attenuates regularly as the distance from the beacon increases. The terminal computers that receive beacon signals are Raspberry Pi single-board computers, and hereinafter they will be referred to as RP's, monitoring terminals, or terminals in this blog. The terminals measure the RSSI values of beacon signals and calculate the distances between the terminals and the beacons based on the degree of attenuation respectively. The signal strength is theoretically attenuated in inverse proportion to the square of the distance, but in reality, there are usually various radio wave interferences; the longer the distance between the beacon and the terminal, the greater the dispersion in RSSI values. Therefore, the distance accuracy will deteriorate eventually.
Figure 2

|
|
Example: Beacon signal strength graph (from Aplix website [Japanese])
|
In the figure above, when the distance between the terminal and the beacon exceeds 1m, the RSSI deteriorates sharply. This means that if you simply measure RSSI values and calculate the distance, the calculated distance may be far from the actual distance. This post is going to show you some RSSI measurement conditions in a few different environments, and give you some considerations on RSSI calibration methods based on the measurement results.
Before moving on to the actual tests, I will explain the devices and the system structure used for this development and testing.
This test used beacons from different vendors including Aplix's MyBeacon general-purpose beacon, Gimbal's Series 10 , and Onix beacons, and beacon monitoring terminals including Raspberry Pi Zero W/WH/3B/3B+.
System development will be easier if you use beacons of one vendor; however, relying on only one vendor will have potential risks in terms of maintenance. Therefore, we used beacons from a few different vendors, aiming to develop a system that supports beacons from multiple vendors for this test.
We used inexpensive, highly reputable, and well known Raspberry Pi series for monitoring terminals. There are many Raspberry Pi models, but the installation position of the signal receiving antenna and the wireless chip (BCM2837B0 for the latest 3B+, BCM2837 for the
others) are different depending on the model, so it is easier to narrow Raspberry Pi models down to one model; however, we used multiple series here in terms of availability in the future, expandability,
and flexibility.
The signals transmitted from beacons are received and processed by Raspberry Pi terminals and written to a database
via an application server. We used SQLite for the database this time, however, it will be more suitable to use multi-user compatible database systems including MySQL and PostgreSQL for handling a large number
of terminals.
Figure 3

|
System Structure Diagram
|
The prototype used in this test is an application including tpcbeaconhost.js, tpcbeaconinfo.js and tpclocation.js modules that run under node.js. These modules recieve signals from each beacon, calculate distances between terminals and beacons, calibrate the calculated distances, and finally update the database by interacting with each other.
table 1
|
Module name
|
Usage
|
|
tpcbeaconsampler.js
|
Installed on each terminal. In response to a request from the application server, data is created based on the detected beacon signal and sent to the application server.
|
|
tpcbeaconinfo.js
|
- Installed on the application server. Sends a request to each terminal. The data received from the terminal is reprocessed as necessary and the database is updated.
- Sends information about terminals and beacons in response to terminal requests.
|
|
tpclocation.js
|
- Installed on the application server. Based on the information on the database recorded by tpcbeaconinfo.js, the distances (radii) are calibrated and the beacon positions are calculated.
- Plots the terminal positions and beacon positions with plotly.js (see Figure 10 below).
- The above process is executed based on the schedule on the application server or upon user's request.
|
Beacon vendor Aplix cites the following factors influencing RSSI [1](Japanese).
- Beacon's transmit outputs, antenna gains, and radiation patterns
- Sensitivity of receiving smartphones, antenna orientation, etc.
- Processing in smartphone OS (such as Bluetooth stack behavior)
- Reflection/absorption/diffraction due to the surrounding environment such as building materials and human body.
For the reasons above, the RSSI values are affected by various factors, so even if the terminal receives signals, the theoretical values and the
measured values will be different. The following tests show how RSSI values are affected by environments, and the "Considerations" sections also briefly describe different calibration methods.
* Applying Apple's iBeacon calibration method in this post
In the following text, the notation "Apple iBeacon Calibration" is described as "Yes" or "No". This means that if the beacon's RSSI values were measured at a point 1m away from iPhones and calibrated by the average of the measured values or not before introducing the beacons. This beacon calibration method is described in the "Calibrating iBeacon" section of Apple's Getting Started with iBeacon (PDF).
* RSSI distance conversion
RSSI values are a logarithmic values of signal strengths, but it is difficult to grasp this image intuitively, so RSSI values are often converted to distance in this post. You can think of RSSI ≒ distance.
Purpose
Check RSSI accuracy and time zone fluctuations using one fixed terminal and one beacon.
Conditions
- Measure one beacon for 24 hours with one terminal.
-
The terminal scans beacon signals for 5 seconds at a time. Approximately 17,000 scans are performed in 24 hours. An average of 34 data samples are collected in a single scan, and the RSSI averages are calculated in each scan. In the figure below, RSSI values are converted to distances (m).
- Actual distance between the beacon and the terminal: 4.5m
- The beacon and the terminal are fixed and do not move.
- Movements of people and objects between and around the beacon and the terminal should be minimized during the test.
- Apple iBeacon Calibration: Yes
Results
The following two figures are plots of the data samples stored in the database.
[Scatter plot 1: Changes in time and measurement distances]

|
|
RSSI values are converted to meters and shown in the vertical axis, and the measurement time is shown in the horizontal axis.
|
|
|
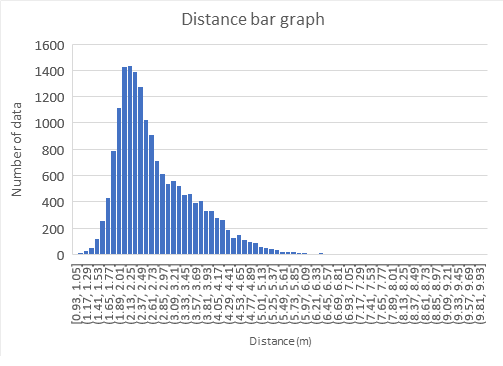
The horizontal axis is the distance, and the vertical axis is the number of occurrences in a bar graph.
|
The average (AVG):2.75M
Standard deviation (SD): 0.88m
Maximum (MAX): 9.96m
Minimum (MIN): 0.93m
Considerations
-
The actual distance between the terminal and the beacon is 4.5m, but the measured value is 2.75m (average value), which is a considerable difference (different from the actual distance). Also, the difference between the maximum value and the minimum value is large.
-
The deviation of the distance is large during the day and small at night. It is presumed that this is because there is little interference from radio waves such as WiFi emitted by people with WiFi devices at night. In addition, the value is higher during the day than at night.
-
From the information above, in order to improve the accuracy of the distance, it is necessary to make calibrations according to the time of the day.
Purposes
-
How much individual differences of the terminals may occur?
- Will different BLE devices make significant differences in RSSI values?
Conditions
- Each terminal scans beacons only once for 10 seconds.
-
The average data samples collected by each terminal are less than 50. The RSSI values (aveRssi in the table below) are the average values. In addition, the RSSI values are converted to the distances (Ave's) in the table below.
-
10 Aplix (AP) and 20 Gimbal (GI) are placed 1m (Dist) from the terminals (Pi1, Pi5-Pi8 in the figure below). Since there are many beacons, they were stored in separate grid-type plastic cases to keep the distance from the terminals as 1m as possible. In addition, Pi5 in the figure is 3B equipped with a BLE dongle, and the built-in BLE is disabled.
Figure 4
- Beacon and terminal are fixed and do not move.
- Movements of people and objects between and around the beacons and the terminal should be minimized during the test.
- Apple iBeacon Calibration: No
Results
Table 2
|
Gimbal |
|
|
Aplix |
|
|
|
| Dist |
RP |
Ave |
SD |
ave
Rssi |
Sample num |
Ave |
SD |
aveRssi |
Sample num |
|
1m |
Pi1 |
0.2m |
0.15 |
-54.26 |
43.52 |
0.21m |
0.09 |
-48.78 |
48.43 |
|
Pi5* |
0.86m |
0.4 |
-67.86 |
56.23 |
1.21m |
0.57 |
-63.97 |
59.05 |
|
Pi6 |
0.18m |
0.09 |
-54.25 |
43.86 |
0.27m |
0.11 |
-51.05 |
44.92 |
|
Pi7 |
0.25m |
0.11 |
-57.18 |
42.38 |
0.36m |
0.15 |
-53.16 |
46.52 |
|
Pi8 |
0.16m |
0.08 |
-52.97 |
44.9 |
0.21m |
0.08 |
-48.85 |
46.47 |
|
Summ. |
0.33m |
0.17 |
-57.3 |
46.18 |
0.45m |
0.2 |
-53.2 |
49.08 |
Legend
* Dist: The actual distance between the terminal and the beacon.
* RP: Raspberry Pi terminal; Pi1/6/7/8 are Zero W, and Ri5 is 3B with BLE dongle attached .
* Ave: Distance between the terminals (RP's) and the beacons calculated from RSSI values (aveRssi's) (unit: m).
* SD: Standard deviation of Ave
* aveRssi: Average of RSSI for all beacons
* Sample num: Number of data samples received from beacons (average values). Received about 46 data samples from each beacon.
* Summ.: Total average
Considerations
-
Even when tested in the same environment using the same type of terminals, there are differences in the RSSI values. In addition, RSSI values of Pi5 have large differences from the RSSI values of the other terminals even though Pi5 uses a BLE dongle.
-
Without the above-mentioned beacon calibration, even though the actual distance is 1m, the measured distance referenced from the RSSI may be totally different from the actual distance.
-
As mentioned above, since there are differences in RSSI values between terminals, it is necessary to make calibrations for each terminal.
Purpose
Study how much difference in RSSI values would become between beacons and vendors.
Conditions

|
|
-
This test has 20 Aplix beacons, 49 Gimbal beacons, and one terminal. The beacons are placed on the circumference of a round table. The distance between the terminal suspended from the ceiling above it and each beacon should be 1m.
-
The terminal scans beacons for 60 seconds and 5 times per set. After completing every set, the table is rotated by 90 degrees and up to four sets (60 seconds x 5 times x 4 sets) of scanning will be performed in the same manner. This is done to round the RSSI values, assuming that the RSSI values will differ depending on the position of the terminal antenna and the beacons.
-
The average number of data samples received by the terminal in a total of 20 scans is about 3600 per beacon. The average of RSSI values is taken upon every scan. The RSSI values are converted to the distances (m) in the figure below.
- Actual distance between each beacon and the terminal: 1m
- The beacons and the terminal are fixed and must not be moved during scanning.
- Movements of people and objects between and around the beacons and the terminal should be minimized during the test.
- Apple Beacon calibration: None
Results
* In the previous graph, [0.2,0.25] indicates that there were three Aplix beacons measured at a distance between 0.2m and 0.25m.
Table 3
| |
Aplix |
Gimbal |
|
AVG(Average distance) |
0.4m
|
0.19m
|
|
SD(Standard deviation) |
0.11m
|
0.08m
|
|
MAX(Max distance) |
0.6m
|
0.4m
|
|
MIN(Min distance) |
0.2m
|
0.1m
|
|
Data Num(Number of data samples) |
3618
|
3606
|
Considerations
-
There are also differences in the measured values for individual beacons; the minimum value and the maximum value can be three or four times different.
- The average value between Aplix and Gimbal is about twice as different.
- From the above, the calibration for individual beacons and the calibration depending on beacon vendors (beacon systems) will be required.
As mentioned above, it was found that the RSSI values and the distances based on the RSSI values differ greatly depending on the time zone, individual terminal, terminal types (beacon systems), individual beacons, and beacon types (vendors).
The following sections describe whether these errors can be calibrated using our prototype system.
(Added on Septermber 24, 2018)
As mentioned above, the RSSI by itself and the distance between the beacon and the terminal calculated from RSSI is unreliable by nature. In order to obtain the position (coordinates) of the beacon by calculation such as trilateration, it is necessary to calibrate this distance so that the accuracy will be improved.
As mentioned above, there is a section named "Calibrating iBeacon" in the Apple document "Getting Started with iBeacon (PDF)", which describes how to calibrate RSSI values as an important issue.
-
Move the iPhone 1m away from the beacon and sample the beacon signals for a minimum of 10 seconds. When sampling, hold the device in a portrait orientation with the top half of the device unobstructed with the palm of your hand, etc..
-
As shown in the figure below, move the device slowly up and down on a 30cm line while maintaining the equidistant distance between the device and the beacon.

|
| Figure from the above Apple document. |
-
Collect RSSI values during the above measurements and apply the average value to the beacon with the application method provided by the vendor.
This method may work well in environments where the beacon is fixed and mobile devices such as iPhone; however, our assumed environment in which the terminals were fixated at a high position such as the ceiling, and many beacons were placed under the terminals did not provide us with good results.
Furthermore, if the number of beacons grows, it will take a considerable amount of time to aggregate and average the measured values and apply the results to individual beacons.
This time we prepared a calibration test environment as shown in the figure below, in order to measure the RSSI values between the terminals and the beacons, and conduct a calibration test. We originally assumed the distance between the terminals (a to i in the figure) to be 10m, however, the differences between the measured values and the actual distances were large, we eventually decided to set the distance between the terminals to 4m each this time.
As shown in the figure, this environment may belong to bad conditions as some terminal are installed right next to the walls or separated by the walls. However, we still decided to conduct tests under these adverse conditions, since the actual operating environment is not always in good conditions.

|
| Figure 5: Test environment |
Legend:
a to i: Raspberry Pi terminals - Detects a beacon and measures RSSI
values
Fix: Fixed beacon attached 1m below the terminal for distance calibration
B: Beacon to be scanned
Blue dotted line: Wall or window which will be an obstacle to radio wave propagation
Devices used
Beacons: Aplix MyBeacon General Purpose Beacon - Only Aplix beacons were used this time to simplify testing.
Monitoring terminals: Raspberry Pi Zero W/WH/3B/3B+
Additional info: According to the system configuration in Figure 3 above
After describing our three calibration methods, the test results will be shown for each method.
As mentioned above, Apple's calibration method is not be very suitable for our model, and it requires a lot of effort and time to apply the measured values (averages) to individual beacons. The calibration method which I am going to show you is an application of this Apple method.
First, as shown in the figure below, arrange the beacons on the circumference of a round table so that the distance of each beacon
from the Raspberry Pi terminal is 1 m. After that, scan the beacons for several tens of seconds to several minutes, then rotate the round table by 90 degrees and scan the beacons. Likewise, repeat the same process four times in total. Finally, store the average value for each beacon in the database.

|
Figure 6: Pre-scanning beacons for calibration using a database
|
The distance (d) between the beacon and the terminal is calculated using the following formula, and RSSI@1meter in the formula is the
value of each beacon stored in the database.

|
| Formula 1: Formula to calculate the distance from RSSI |
Instead of registering the value (RSSI@1meter) in the beacon one by one like Apple's manual, this method allows you to scan beacons all at once and register them in the database all at once. This is an advantage because it does not require any dedicated beacon management services from vendors.
Note: RSSI@1meter is called such as TxPower and Measured Power, and the names are not unified. It seems a little strange to call RSSI TxPower at 1m point.
In Test 2 above, although the signals of the beacons 1m apart were measured under almost the same conditions, the calculated distances
differed considerably depending on the terminal. In addition to individual differences in terminals, radio waves are affected in various ways depending on the time of day and installation location. A beacon (fixed beacon) dedicated to calibration is placed 1m below the terminal, and the actual distance of 1m is divided by the measurement distance to make a coefficient. For example, if terminal A measures the RSSI of this fixed beacon and the distance calculated from the RSSI value is 0.5m, then 1m ÷ 0.5m = 2 is the terminal coefficient. This coefficient is applied to all beacon signals received by terminal A.
The third calibration method is called Area Calibration. Formula 1 above has coefficient n, which is called the path-loss index. The path-loss index is 2 in an ideal environment. However, radio waves are affected by interference, attenuation, diffraction, reflection, and absorption, and therefore the path-loss index (n) varies depending on the location of the terminal and the beacon.
Expanding Formula 1 to find n gives:

|
| Formula 2: Calculation formula for path-loss coefficient n |
In this method, calibration is performed using this coefficient n.
First, tpclocation.js application finds n between two adjacent fixed beacons as follows:
Figure 7
Next, each terminal with tpcbeaconhost.js uses the uncalibrated RSSI values obtained by scanning to identify the terminal closest to the beacon (No1
terminal, F1 in the figure). If you identify the No1 terminal, you can identify its proximity terminals (b, d, f, h in the figure). The distance (d) from terminal b to beacon B is calculated using Formula 1 as follows:

|
| Formula 3 |
Similarly, find the distance from terminals d, f, and h to beacon B.
For trilateration, use the coordinates and distances (radiii) of the three terminals with the shortest distance.
Note:
I would like to delve into the use of data from terminals on the diagonal of No. 1 terminal and trilateration in future posts.
The following are the measurement results by the above three calibration methods. The test environment is shown in Figure 7, and three or four beacons denoted as B to be measured are placed directly under each terminal. Ideally, the beacons should be distributed randomly, but this arrangement makes it easier to evaluate the test results. The data is extracted from the actual distances of 1m and 4m and shown as average values.
Table 4
| Actual distance
|
Uncalibrated
|
DB Beacon Calibration
|
Terminal calibration
|
Area calibration
|
| 1m
|
0.62
|
1.95
|
2.32
|
2.68
|
| 4m
|
2.75
|
8.05
|
18.86
|
1.59E + 28
|
Unfortunately, the uncalibrated values are the closest to the actual values after all. The poor results are probably due to the devices being too close to or surrounded by walls as mentioned above, and they caused significant interferences. Another
factor of Database Beacon Calibration is that the terminal locations when acquiring the RSSI@1meter values are different from the actual
terminal locations (a to i). Terminal Calibration may be unreasonable to apply the terminal coefficients calculated based on RSSI@1meter to beacons presenting at different distances.
The results of the Area Calibration were far from the actual distances, as exponential notations even appear. This occurs when the path-loss coefficient n has an abnormal value. After consideration on some conditions when n becomes an abnormal value, we modified the application to use uncalibrated values without applying the Area Calibration. The results are as follows:
Table 5
| Actual distance
|
Uncalibrated
|
DB Beacon Calibration
|
Terminal Calibration
|
Terminal Calibration
(unadjusted)
|
Area Calibration
(with adjustment)
|
| 1m
|
0.62
|
1.95
|
2.32
|
2.68
|
0.98 |
| 4m
|
2.75
|
8.05
|
18.86
|
1.59E + 28
|
3.63
|
The adjustment has made it much closer to the actual distance.
(added on February 7, 2019, partially revised on March 10, 2019 including the table and figures.)
Trilateration typically obtains the contact points by the following equations with the three circles intersecting as shown in the "ideal" in the figure below, and detecs the centroid as the position of the target (the beacon in this case).
Formula 4
r
1
2 = (x --x
1 )
2 + (y --y
1 )
2
r
2
2 = (x --x
2 )
2 + (y --y
2 )
2
r
3
2 = (x --x
3 )
2 + (y --y
3 )
2
Figure 8

However, even after the RSSI/distance calibration in our test, the three circles rarely intersect as "ideal" in the figure above. Even plotting the results with the calibrated data produce various patterns. The "reality" in the figure above shows only a few examples, and there are actually fifteen plot patterns as far as we are aware [2]. When a plot pattern in which the three circles do not intersect neatly, such programs that "simply find the centroid from the intersections of the three circles" will just fail, or return an error.
After recognizing these facts, we first tried to prepare formulas corresponding to those fifteen plot patterns, including Formula 4 above, and put them in the source code; however, we came to realized that it will take tremendous time as we proceed the coding. After all, we decided to make our application correspond only to plot patterns that appear frequently, with an idea to develop a "general-purpose processing" for patterns that appear not that too often. Due to time constraints at that time, we decided to put aside the general-purpose processing for the time being, and prepared a test program corresponding to some plot patterns and use it instead. However, the calculation results of the beacon coordinates were still poor.
And finally we came back to the above-mentioned "general-purpose processing" and its expanded application with the intention to apply the solution to all or many plot patterns, and this solution is called "Two-Circles-Oriented Trilateration," which follows next.
In this test model, the Raspberry Pi terminals are arranged in a grid pattern. Each terminal scans beacon signals and sends information such as RSSI to the database server. The server identifies the top 1 to 3 terminals that recognize that the distances (radii) between the beacon and the terminal are the shortest. Even if the number of terminals increases, the information of the top three terminals will be used.
Figure 9
For example, suppose the terminal with the shortest distance to a beacon is C1, the second is C2, and the third is
C3. In this case, when calculating the x-coordinate of the beacon, the server does not consider the C3 terminal and calculates only the information of the C1 terminal and the C2 terminal. The calculation rules are as shown in the table below.
Table 6
| Status
|
Distance classification |
Conditions for calculating x-coordinate |
x coordinate calculation formula |
Image |
| 1. Separation |
A. Remote |
The two circles separate beyond a certain distance, and the radius of C1 (C1r) is smaller than the radius of C2. |
C1x + C1r |
|
| B. Proximity |
The two circles are separated within a certain distance |
C1x + d/2 |
|
| 2. Cross |
C. C2 within the center of the circumference |
Two circles intersect and the circumference of C2 never exceeds the center of C1 |
C1x + C1r- d/2 |
|
| Ce. C2 in the center of the circumference, extremely small |
Under the same conditions as C above, and the C1 radius relative to the C2 radius is less than a certain ratio (the radius of C1 is very small). |
C1x + c1r |
|
| D. C2 outside the center of the circumference |
The circumference of C2 exceeds the center of C1 |
C1x |
|
| 3. Inclusion |
D. C2 outside the center of the circumference |
C2 includes C1 |
C1x |
|
y coordinate is calculated based on the rules in the above table using the coordinates of C1 and C3.
We placed four terminals and one beacon as shown in Figure 9 for this test. At point "B" in Figure 9, there are four or five beacons including fixed beacons, and there were 40 beacons in total including fixed beacons. The beacon, which can be seen at the same position as the terminal, is placed 1m directly below the terminal. As shown in Figure 7, there were walls and windows between the terminals and the beacons, and it is estimated that the radio waves were far from ideal conditions.
The figure below is a calibration and drawing of the data sent by the terminal by the program tpclocation.js created based on the above logic. ● indicates the coordinate calculated by "Two-Circles-Oriented Trilateration", and ■ indicates the actual coordinate.

|
tpclocation.js generates the distances between the terminal positions (the center of each circle) and the beacons.
|
Legend
Terminal: The name of the terminal used
x: x coordinate, y: y coordinate
Distance: The distance from the terminal to the beacon (radius)
Acual (■): The actual beacon position
Calc. ( ● ): The beacon position calculated by Two-Circles-Oriented Trilateration
Gap: |Actual.x --Calc.x| + |Actual.y --Calc.y| , distance error
Results
The results of Two-Circles-Oriented Trilateration using 40 beacons are as follows:
Average distance error: 2.36m
Maximum distance error: 6.03m
The Two-Circles-Oriented Trilateration described in this post is a positioning model based on the assumption that the terminals are arranged in a square grid. In the next post, we will aim to improve positioning accuracy by adding a terminal to the center in the square. Since this center terminal and other terminals will have angles now, the current Two-Circles-Oriented Trilateration will be expanded.
We will also study the errors in positioning when the distance between terminals is changed from 4m to 8m, to 16m, and to 32m. For details, see our
[Next] post .
Naoki Tsuchiya
References:
^ [1] Characteristics of short-range positioning using Beacon [Aplix]
^ [2] Intersection of 3 circles calculator (displays 13 plot patterns)
Talk: Trilateration / Archive 1 ("Trilateration" is "Multilateration" in Wikipedia Reasons for integration into, C ++ source, etc.)
-
IPS Application Templates for FileMaker ― QuickIPS ―*
-
Indoor Mobile Position Monitoring Model with iBeacon/Raspberry Pi 1 ― Overview*
-
Indoor Mobile Position Monitoring Model with iBeacon/Raspberry Pi 2 ― RSSI/Distance Calibration and Trilateration*
-
Indoor Mobile Position Monitoring Model with iBeacon/Raspberry Pi 3 ― Enhancement of Two-Circles-Oriented Trilateration (TCOT) and Measurement Results*
-
Estimate the approximate position of the beacon with a small number of receivers in a large area such as Tokyo Dome(Google translate)
-
Improving IPS Positioning Accuracy with Machine Learning *
-
TIPS for making IPS testbeds(Google translate)
-
Object Tracking for Visualizing The Movements of People and Objects on a Map*
-
Send Location Information via UDP - TPC_IPS/QuickIPS Extension*
- * indicates that original article translation into English has been completed by TPC.
- "Google translate" indicates that clicking it will Google translate the original article, and may be translated into English in the near future by TPC.
TPC's IPS Products


